Depletion
The Depletion module in whitsonX predicts the expected performance degradation of a new child well caused by nearby existing parent wells. The method combines an undepleted child-well performance baseline with an empirical depletion equation that accounts for parent-well production, parent-child distance, vertical separation, and lateral overlap.
The predicted depletion degradation can be applied to an undepleted type-well production profile to support well-spacing, inventory, development, and economic evaluations.
1. Introduction
Existing wells are referred to as parent wells, while newer wells drilled and stimulated near those existing wells are referred to as child wells. Child wells commonly perform below the level expected in the absence of offset parent wells.
Depletion versus Depletion From Degradation
Depletion refers to the lower-pressure reservoir region created by production from a parent well. Depletion From Degradation refers to the resulting reduction in child-well performance relative to an undepleted performance baseline.
Several mechanisms may contribute to the degradation observed in child wells. These are mentioned below.
- Decrease in Reservoir Pressure
- Distortion of Fracture Geometry
- Transfer of Volumes from Child to Parent
1.1. Decrease in Reservoir Pressure
The parent well reduces reservoir pressure within part of the volume that may subsequently contribute to the child well. As the distance between the parent and child wells decreases, a larger fraction of the child well's drainage volume may overlap reservoir volume that has already been depleted.
At sufficiently large separation, the parent and child drainage volumes may no longer overlap and the pressure-depletion effect should approach zero. The distance at which this occurs depends on the reservoir, but may commonly be in the range of approximately 500-1,000 ft.
The magnitude of pressure depletion also depends on the volume produced by the parent well. For an undersaturated oil reservoir, such as those commonly encountered in the Midland Basin, reservoir pressure may decline rapidly above the bubble point because of low liquid compressibility and then decline more slowly below the bubble point. Therefore, the relationship between produced volume and depletion is expected to be nonlinear.
1.2. Distortion of Fracture Geometry
The child well's hydraulic fractures may initially grow relatively symmetrically. When the fractures encounter the lower-pressure region surrounding a parent well, fracture growth may become asymmetric and preferentially extend toward the parent.
This behavior may reduce the total new fractured surface area created by the child well and direct additional fracture growth toward reservoir volume already being drained by the parent. Because hydraulic-fracture interaction may extend beyond the effectively drained or propped region, this mechanism can influence child-well performance at larger parent-child distances than pressure depletion alone.
The effect should still decrease as parent-child distance increases because a larger separation allows more symmetric fracture growth before the child fracture encounters the parent-well depletion region. Vertical stress differences and directional fracture-height growth may also cause the interaction to differ depending on whether the child well is above or below the parent well.
1.3. Transfer of Volumes from Child to Parent
If the parent and child fracture systems are well connected, fluids may move from the higher-pressure child-well region toward the lower-pressure parent well. A pressure difference is especially likely between the end of the child-well fracture treatment and the start of child production, and it may remain during the early production period.
From the perspective of the child well, this transfer may appear as production degradation. From a total-development perspective, however, the transfer may be approximately zero-sum if the parent well produces the transferred volumes. Because a corresponding parent-well production increase is not commonly observed in the Midland Basin dataset, this mechanism was considered minor and is not included explicitly in the empirical formulation.
2. Conceptual Model
The conceptual depletion model separates the observed child-well performance difference into depletion intensity and a distance-decay function:
where Degradation From Depletion is the observed performance deviation, Child Actual Performance is the actual child-well performance, and Baseline is the expected child-well performance without parent-child interaction. A negative value of Degradation From Depletion represents degradation relative to the baseline.
2.1. Child-Well Performance Baseline
An undepleted performance baseline is required before depletion degradation can be quantified. The baseline represents the expected performance of the child well if no parent-child interaction were present.
For example, assume a well is expected to produce 120 Mbbl of oil during its first year based on lateral length, completion design, spacing, landing zone, reservoir quality, and location. If the well is drilled near a parent well and produces only 90 Mbbl during its first year, the observed deviation is:
For the Midland Basin calibration, a neural network was trained separately for each formation using public well data. The model included the following variables:
- Lateral length
- Frac proppant
- Frac fluid
- Well spacing
- Horizontal depletion
- Mapped initial GOR
- Mapped water cut
- Wellbore azimuth relative to
- Vertical position within the formation
- Latitude and longitude
The baseline for each well was calculated using the well's actual input variables while setting horizontal depletion equal to zero. The resulting neural-network prediction of undepleted one-year cumulative oil was compared with actual one-year cumulative oil:
The resulting value of Percentage Degradation is the target variable used to calibrate the empirical depletion equation.
2.2. Depletion Intensity
For the reservoir-pressure and fracture-distortion mechanisms, depletion intensity is expected to be related to the reservoir-pressure decline caused by the parent well. Because pressure decline and the affected reservoir volume are difficult to estimate directly for every parent well, empirical proxies are used.
Potential proxies include parent cumulative production, cumulative production normalized by original oil in place or expected ultimate recovery, parent time online, and parent fracture intensity. Parent cumulative production is a direct measure of withdrawn volume, while normalized measures help account for variations in reservoir quality.
For the volume-transfer mechanism, depletion intensity may also be related to the time between the child-well fracture treatment and the start of child production. This mechanism is not included in the current empirical formulation.
2.3. Decay Function
The effect of depletion decreases with increasing distance from the parent well. For the pressure-depletion mechanism, the impact may approach zero when the parent and child drainage volumes no longer overlap. For the fracture-distortion mechanism, the interaction may extend farther because hydraulic fractures can propagate beyond the effectively drained region.
An exponential decay function is used to represent the decrease in degradation with increasing distance. Vertical separation is adjusted separately from horizontal separation to account for differences in upward, downward, and lateral fracture growth.
2.4. Other Considerations
Three additional factors are included in the conceptual model.
-
Parent and child wells may have different lateral lengths or may be offset along the wellbore direction. Therefore, only part of the parent well may overlap the child well. The model accounts for this using the percentage of the child lateral overlapped by the parent.
-
A child well may have multiple parent wells. The current formulation assumes that the depletion contributions from all parent-child interactions are additive.
-
The product of depletion intensity and the decay function does not inherently produce a percentage. A formation-specific scaling factor is therefore used to convert the empirical result into predicted percentage degradation.
3. Empirical Implementation
The empirical depletion degradation model is:
where,
- Degradation From Depletion = Predicted depletion degradation magnitude
- Alpha = Scalar to convert equation to percentage degradation, tuned for each formation
- % Child Overlapping = Percentage of the child well that the parent is overlapped (0%-100%)
- Depletion Intensity = Variable to represent depletion intensity
- = Decay factor to control how depletion decays with distance, tuned for each formation
- Equivalent Distance = Distance factor (in feet)
3.1. Equivalent Distance
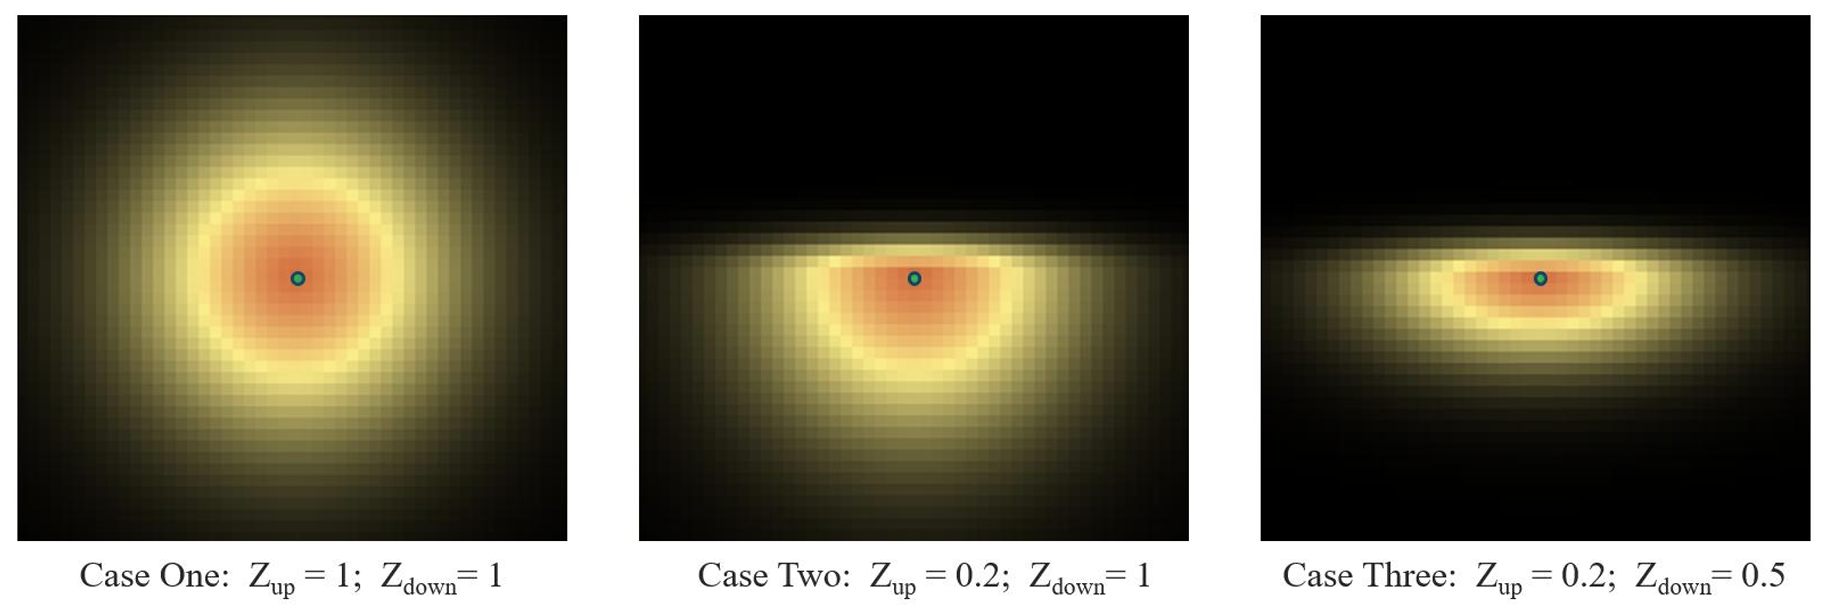
Equivalent distance combines horizontal distance and vertical separation while allowing different interaction geometries above and below the parent well:
where,
- = Horizontal distance between the overlapping portions of the parent and child wells
- = Depth multiplier.
A positive value of indicates that the child well is above the parent well.
- A equal to 1 represents circular geometry, meaning that the vertical component is not adjusted.
- A greater than 1 represents greater interaction extent in the applicable vertical direction relative to the horizontal direction.
- A less than 1 represents less interaction extent in the applicable vertical direction, which may indicate vertical stress barriers or limited fracture-height growth.
4. Calibration of Geometry Inputs
The geometry parameters , , and were calibrated using all potential parent-child relationships identified in the Midland Basin dataset. The dataset contained more than 24,000 horizontal wells, including approximately 12,500 potential child wells located within 2,000 ft of an existing parent well. Because one child well may have multiple parent wells, the analysis included approximately 60,000 parent-child pairings.
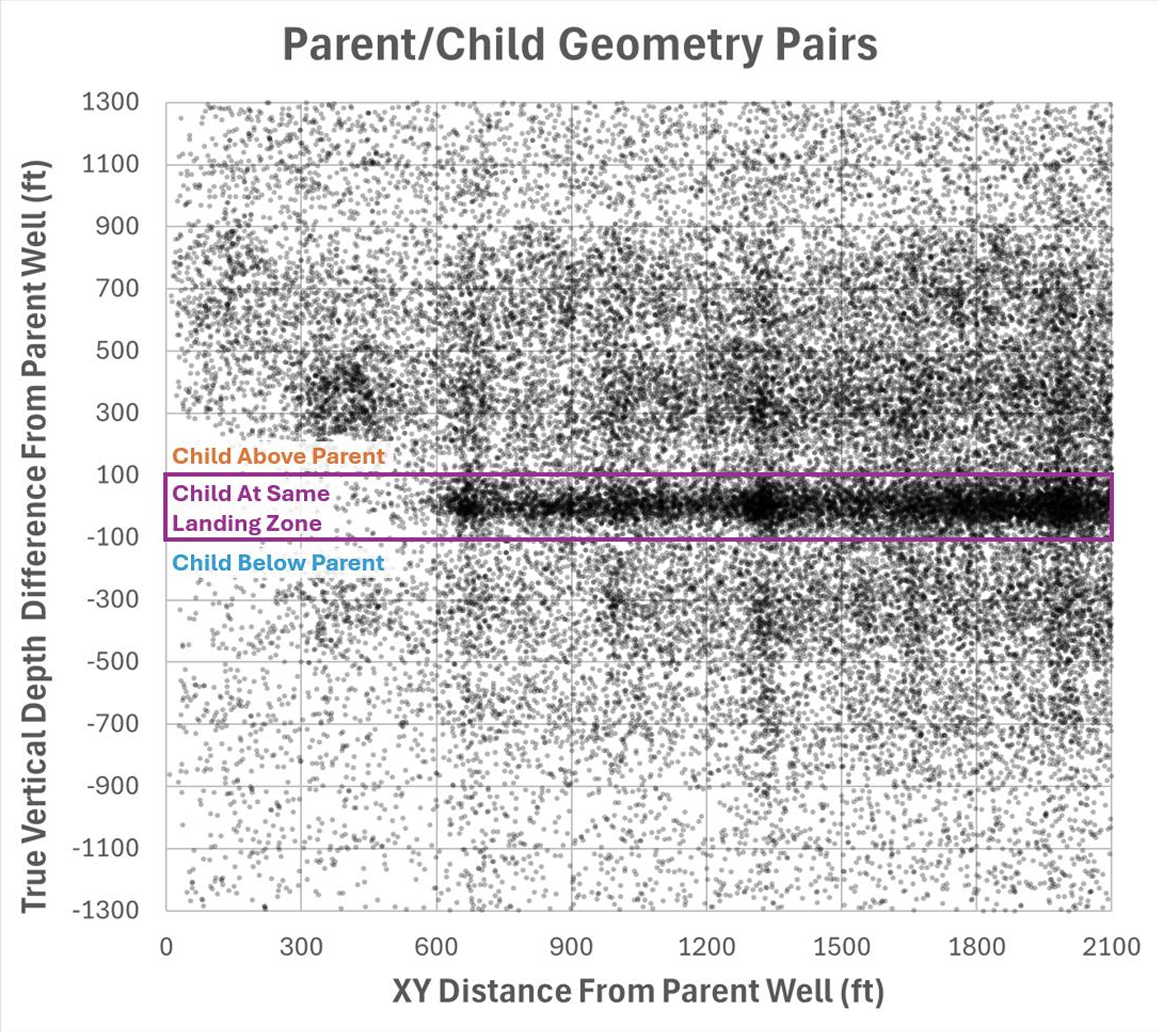
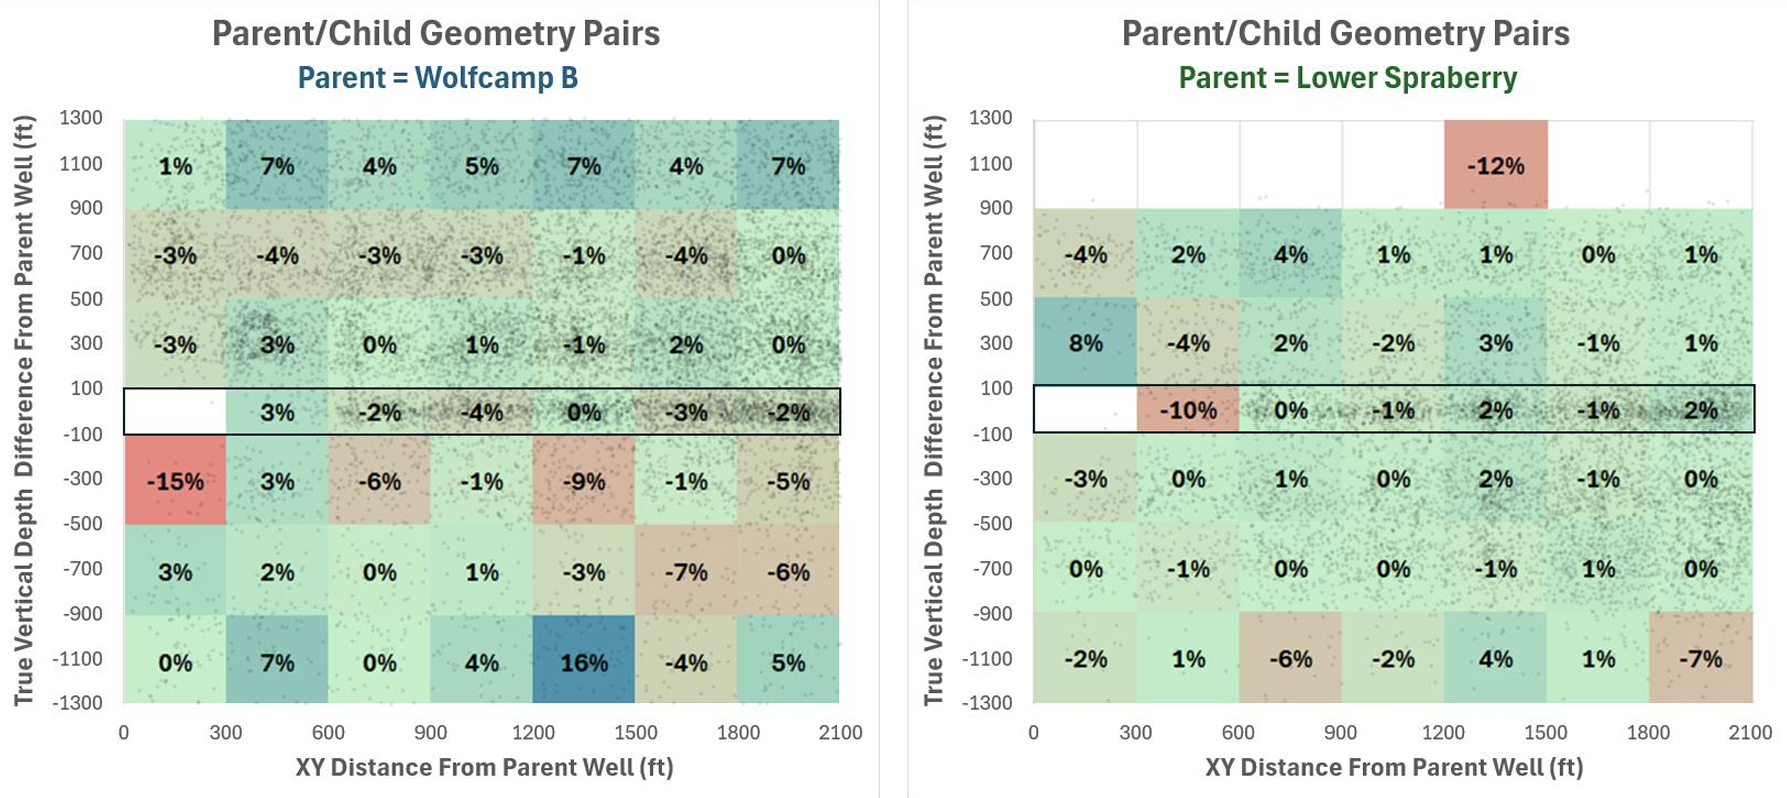
For visualization, each parent well was placed at the origin and the corresponding child-well position was plotted using horizontal distance and depth difference. Grouping the parent-child pairs by geometry allowed average actual child-well performance to be compared with the undepleted baseline at different positions relative to the parent.
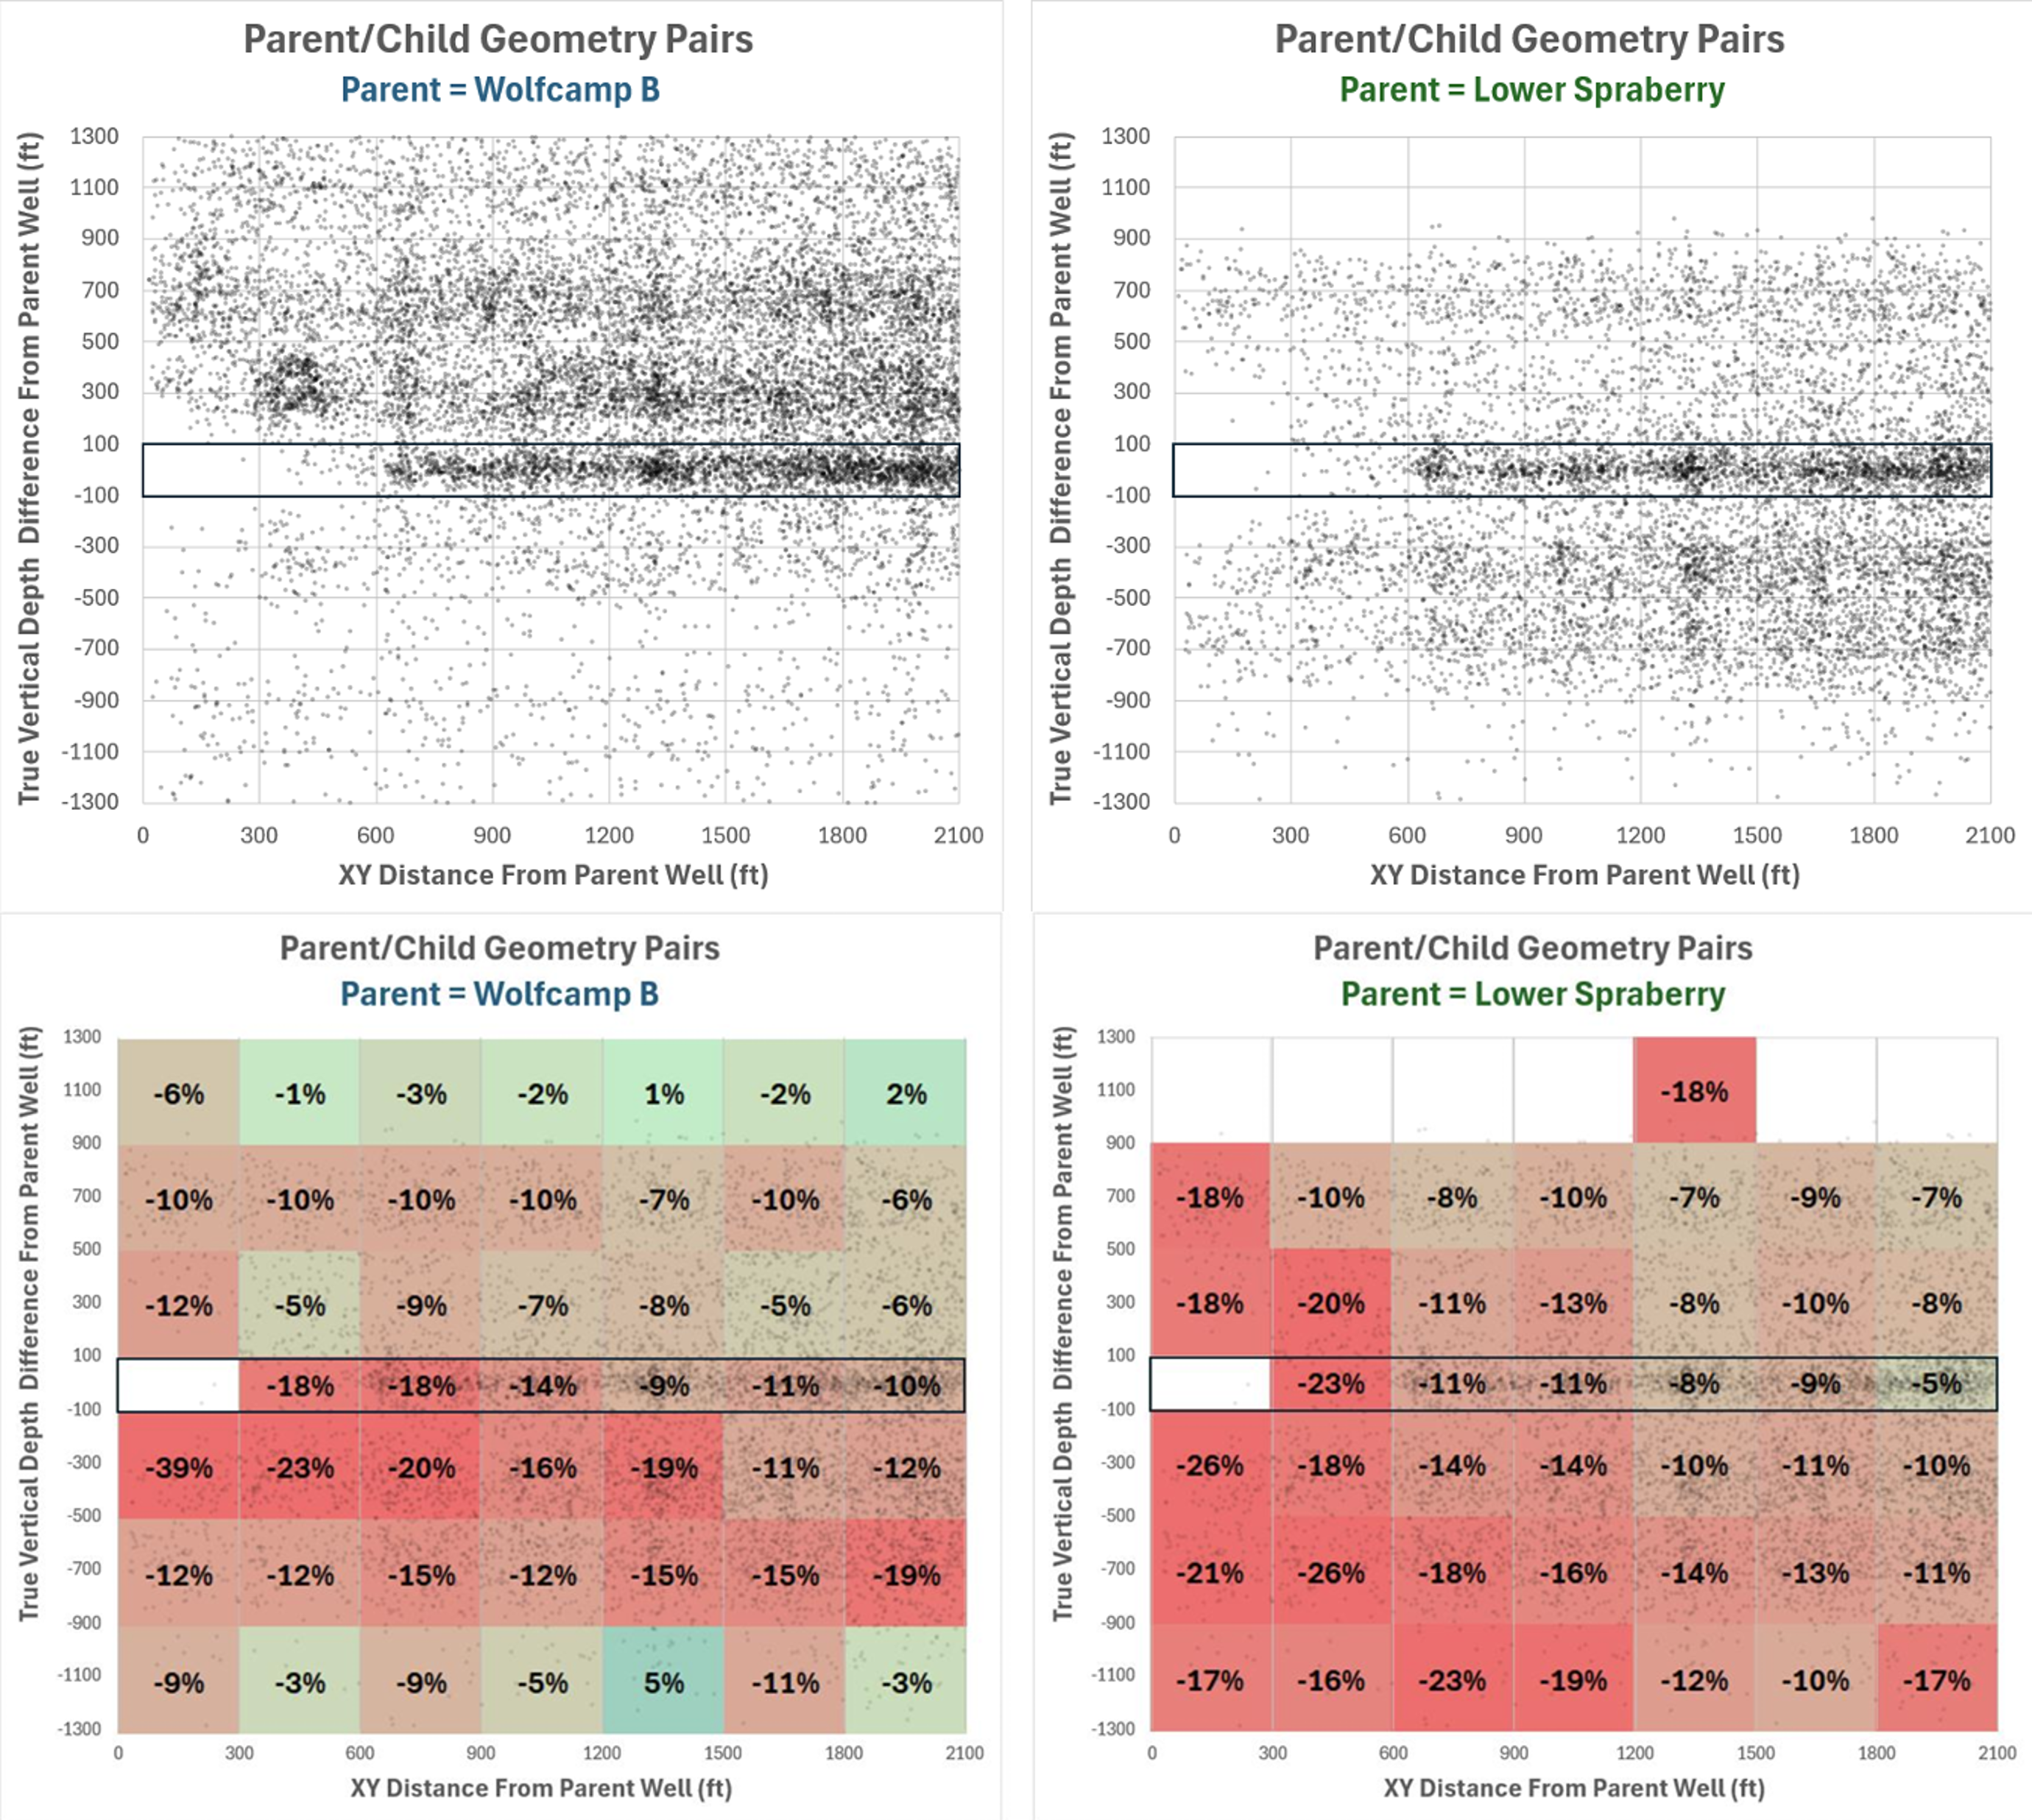
The calibration showed that depletion degradation was generally negative and commonly ranged from approximately -10% to -30% on average. Degradation was generally greater for child wells located below a parent well than for child wells located above a parent. Depletion effects were also observed beyond 1,000 ft, although the magnitude decreased with distance. These observations support the contribution of fracture-geometry distortion in addition to drainage-volume overlap.
The geometry parameters were tuned separately for each parent formation. The predicted degradation from all parent wells was added to the undepleted baseline and compared with actual child-well performance. The final tuning minimized the average prediction error while weighting the calibration by the number of wells represented within each geometry group.
5. Empirical Calibration of Depletion Intensity
Several depletion-intensity measures were evaluated after calibrating the geometry parameters:
- No parent-child consideration.
- Flat intensity, where all parent-child interactions were represented by a binary flag.
- Parent cumulative oil at the time of the child-well fracture treatment, including a natural-logarithm transformation.
- Parent time online at the time of the child-well fracture treatment, including a natural-logarithm transformation.
- Parent frac size, using proppant and fluid per foot.
- Parent cumulative oil divided by parent forecast EUR.
- Parent cumulative oil divided by parent one-year cumulative oil, including powers of 1.5 and 2.
- Parent cumulative oil divided by frac-normalized parent one-year cumulative oil, raised to the power of 1.5.
The values of the error metric vs. the method used to calculated intensity are shown in the figure below.
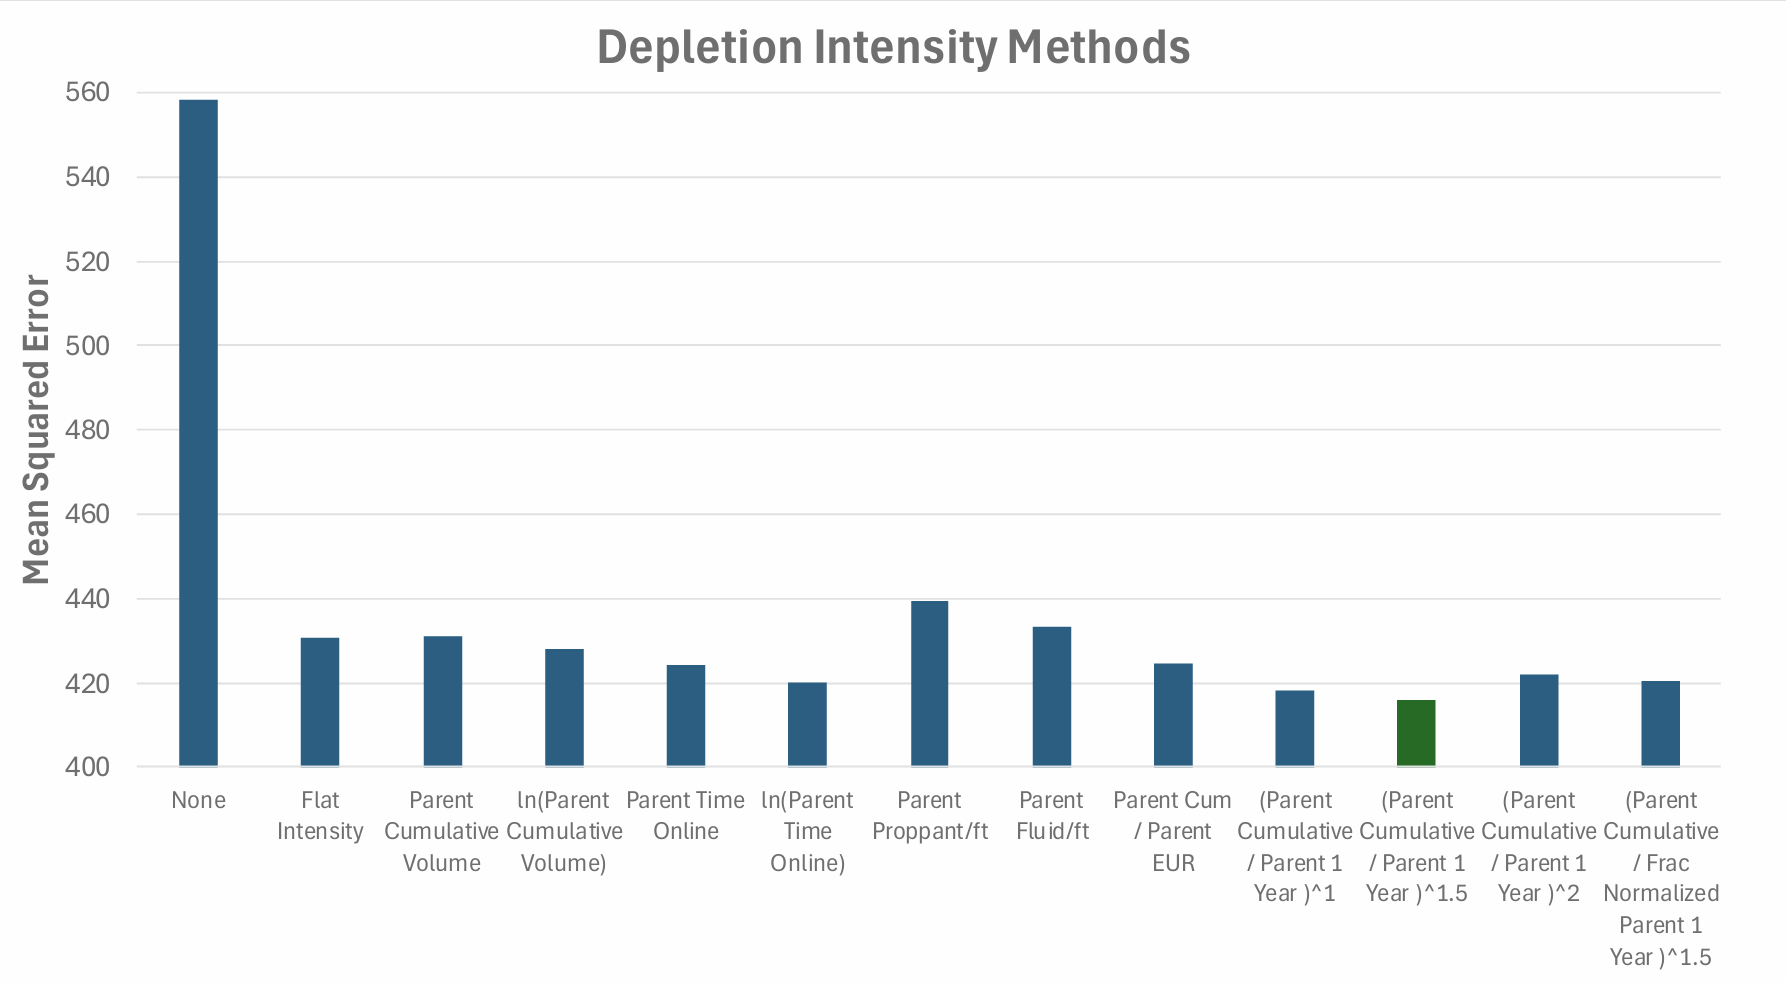
Including any parent-child interaction metric substantially improved predictive performance compared with excluding depletion. However, the differences among the tested depletion-intensity metrics were relatively small.
Parent frac size was one of the least effective standalone indicators of depletion intensity. Parent cumulative volume alone also performed poorly when applied regionally because the same produced volume may represent different degrees of depletion in reservoirs of different quality.
Parent cumulative oil divided by parent forecast EUR provided a reasonable measure but required an EUR forecast and introduced additional forecast uncertainty. Parent cumulative oil divided by parent one-year cumulative oil performed best because it partially normalized for reservoir quality and reduced the effect of persistent allocation bias. Raising this ratio to the power of 1.5 produced the lowest error among the evaluated methods.
6. Final Empirical Formula
Combining the calibrated geometry and depletion-intensity terms gives:
The calibrated constants are selected according to the parent-well formation.
| Parent Formation | Alpha | \(k\) Decay | \(Z_{Up}\) | \(Z_{Down}\) |
|---|---|---|---|---|
| Middle Spraberry | 0.11 | 0.0030 | 1.43 | 1.43 |
| Jo Mill | 0.30 | 0.0027 | 1.25 | 1.25 |
| Lower Spraberry | 0.10 | 0.0012 | 0.56 | 0.83 |
| Wolfcamp A | 0.12 | 0.0015 | 0.48 | 0.71 |
| Wolfcamp B | 0.45 | 0.0024 | 0.25 | 0.56 |
| Wolfcamp C | 0.35 | 0.0015 | 0.20 | 0.66 |
| Wolfcamp D | 0.22 | 0.0020 | 0.25 | 0.66 |
Midland Basin Coefficient
The Midland Basin coefficients were calibrated empirically and should not be assumed to represent other basins or formations without local validation or recalibration. The prediction must also be applied to a type well that does not already include depletion degradation; otherwise, the depletion effect will be counted twice.
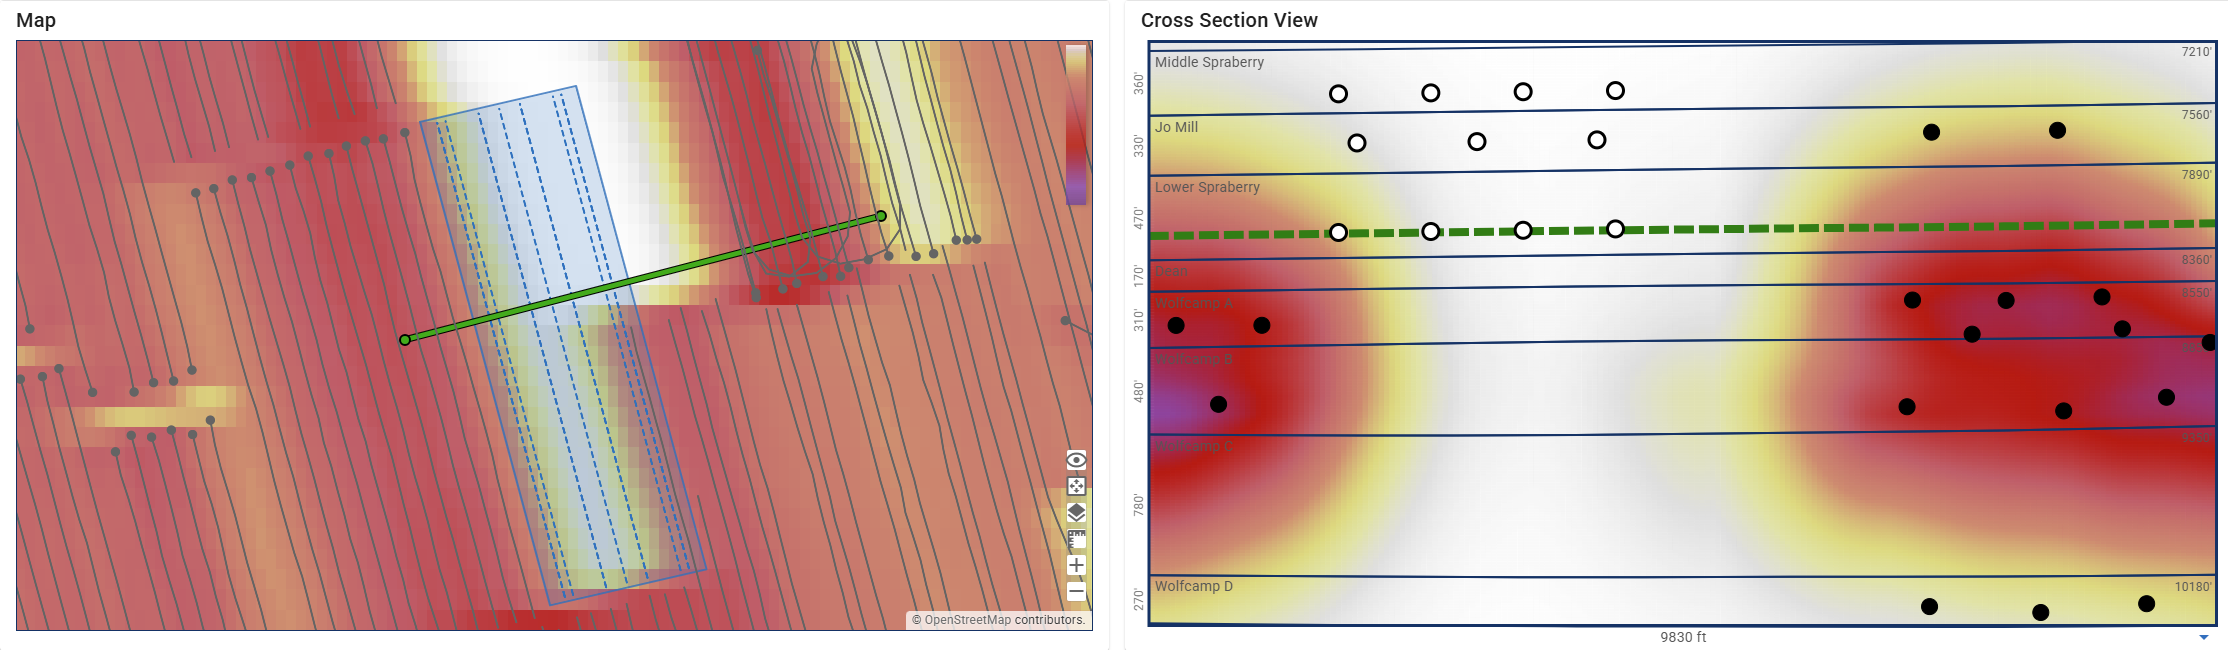
Using the final empirical formula above, it is then possible to propagate out the expected depletion degradation from each parent well. Below in the figure is a visualization of the predicted depletion degradation predicted. The left side of the figure shows the map view, corresponding to a certain depth (the dashed green line from the cross section on the right). The right side shows the depletion vs. depth, for the cross-section line in green from the map on the left.